Question
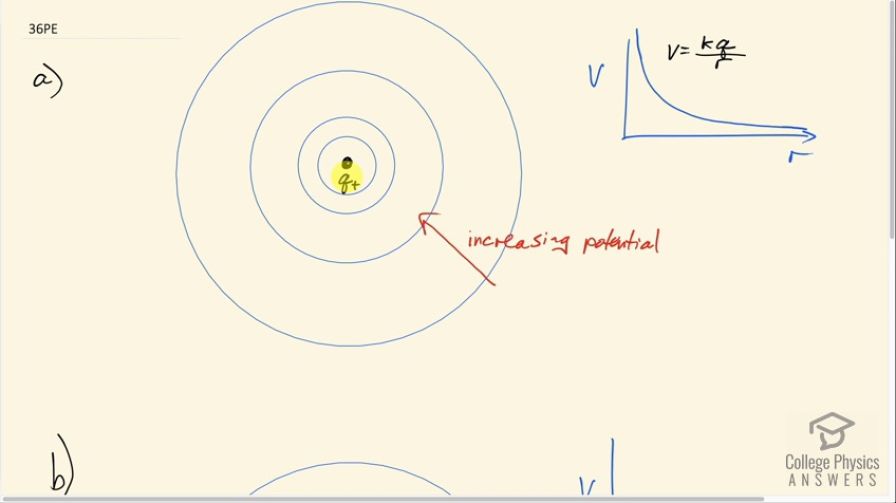
(a) Sketch the equipotential lines near a point charge . Indicate the direction of increasing potential. (b) Do the same for a point charge .
Final Answer
Please see the solution video.
Solution video
OpenStax College Physics, Chapter 19, Problem 36 (Problems & Exercises)

vote with a rating of
votes with an average rating of
.
Video Transcript
This is College Physics Answers with Shaun Dychko. This diagram shows equipotential lines in concentric circles around this positive charge in the center. The direction of increasing potential is towards this positive charge and I have shown over here a graph of potential versus distance from the charge and it's given by the formula potential equals Coulomb's constant times the charge divided by the distance. So between these equipotential lines, there is meant to be a fixed difference in potential; I haven't written any numbers on this picture but the idea is that the potential difference between this line and this line is meant to be the same as the potential difference between this line and this line and since that's the case, their different spacing tells you something about how the potential is changing with distance. It shows you that to ha ve a given change in potential, you need to go a greater distance farther away you are and you can see that from this graph because if we were to drop, say this many volts, we would have to go only this small distance here, let's call that r 1, whereas starting from this further position and dropping that same number of volts again so the same vertical change between these two points here, we are now gonna go a greater distance r 2 this interval r 2 is greater than r 1 just like this would be here, this would be r 2... this distance here whereas this one would be r 1. And then from here to go down that same vertical distance, you have to go really quite far and let's imagine—although my drawing is not perfect— that this is the same vertical separation as this and this but now you can really see that the change in r is greater still and this would be r 3 here. Okay! So your graph of equipotential lines should show that increasing spacing between equipotential lines. Okay! And the reason this is an equipotential line is that the electric field is radiating outwards from this charge and since the direction is radial that means to go perpendicular to this electric field, there will be no work done by this force and so it takes no energy to go from here to here along this curve path and for that reason, these two points are at the same potential. Okay! So if you had negative 3q as your charge in the center instead of positive q, the picture is going to be the same although the amount of difference between these lines will be different but the picture would be the same, it's just a different scale because this is 3 times the charge now and so this would be 3 times the interval in potential. The direction of increasing potential is now outwards from the charge because here's a graph of potential versus distance from the charge and it's very negative close to the charge and then becomes less and less negative or tending towards zero as you go further way and so going further away increases the potential because this point here is higher up than this point here. Yeah... and there we go!