Question
Push a book across a table and observe it slow to a stop.
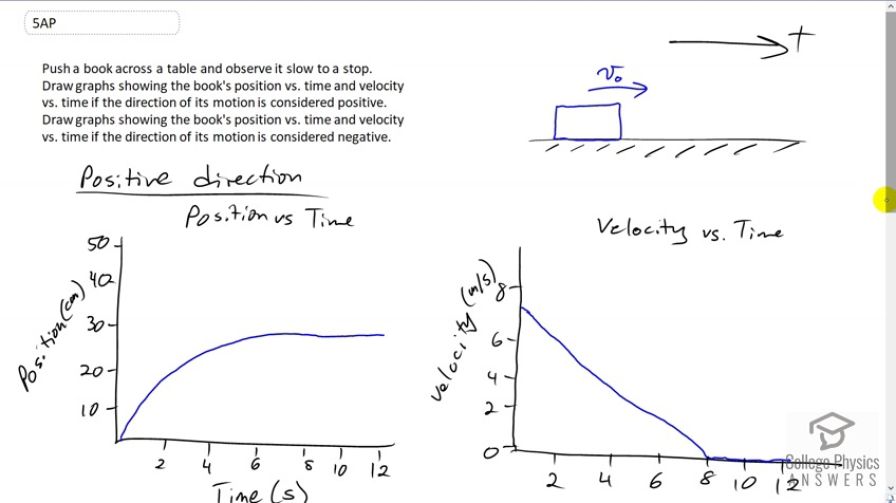
Draw graphs showing the book's position vs. time and velocity vs. time if the direction of its motion is considered positive.
Draw graphs showing the book's position vs. time and velocity vs. time if the direction of its motion is considered negative.
Final Answer
see video for description of graphs.
Solution video
OpenStax College Physics for AP® Courses, Chapter 2, Problem 5 (Test Prep for AP® Courses)
vote with a rating of
votes with an average rating of
.
Video Transcript
This is College Physics Answers with Shaun Dychko. We're going to draw position-time graphs and velocity-time graphs for this book sliding across a horizontal table assuming that initially it's going in the positive direction, and then in the second case, assuming that it's initially going in the negative direction. Now, we also assume that we begin drawing a graph at the moment when the person's hand is no longer touching the book and so it's just slowly slowing down as a result of sliding friction with the table. So, let's draw our vertical and horizontal axes and label them with what they are position on one hand and horizontally it's Time. Give some units, centimeters and seconds and do some realistic numbers. Our position-time graph, well it starts at, let's say we call this position zero and then it slowly is changing its slope until the point where it's no longer moving at all once it gets to 8 seconds because at that point, its position is at 30. So eventually this book is going to move along here 'till finally at 8 seconds, it stops. So from 8 until 12 this position has not changed. And then drawing a velocity versus time graph of that situation, we have that initially the velocity is at it's greatest when the hand is, just at the moment it is no longer touching the book and releases it. And then it is slowing down at a constant rate because the friction with the table top, force of friction is the coefficient of sliding friction or kinetic friction between the book and the table, multiplied by the weight of the book which is the normal force of the table. But anyway all this is I guess, in the later chapter. But all that to say that the force of friction is constant and because of that the deceleration of the book is constant. So, because it's constant, we expect this velocity-time graph to be a straight line having a constant slope. Okay, so it starts at some y intercept here, some positive number, that's important because it is going in the positive direction and until it gets to 8 seconds at which point the velocity is finally zero. And then this velocity graph is going horizontally here from 8 until 12. There we go! And then if the book is initially going in the negative direction, I suppose it starts at this final position of 30 and to the right is defined as positive. But the book is going to move to the left. That means that its initial position, the y intercept in other words, will be 30. And then its position will reach zero eventually and it'll stop over here at position zero. And that's represented on this graph at 8 seconds, it'll stop at position zero. And this graph has a slope showing that the speed is changing and so the slope here is the most negative it will be, at the beginning, and then the slope of the tangent line at this point say, is a little bit less magnitude, and then the slope here is even less magnitude and so let's represent those different slopes on the velocity-time graph. Because the velocity-time graph is a graph showing the slope of the tangent line of the position-time graph at all times. So the slope of the position-time graph is of greatest magnitude here, the smallest number, negative seven and a half or so centimeters per second -- should make my units correct there, centimeters per second, yeah need to fix that up there too. The velocity is initially negative 'cause it's going in the negative direction and then the magnitude of its velocity is decreasing, decreasing, decreasing until it gets to zero at 8 seconds and it's finally reached its final position of zero as well. And so the velocity-time graph is going horizontal between 8 and 12. There we go!