Question
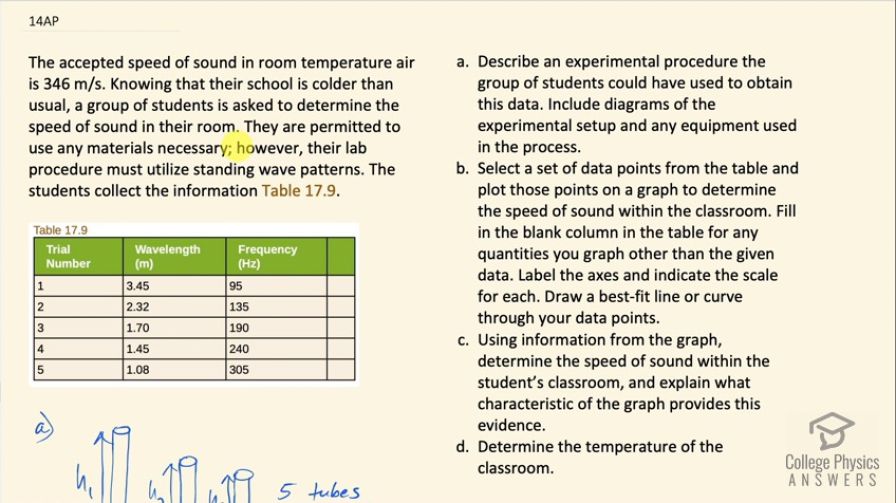
The accepted speed of sound in room temperature air is 346 m/s. Knowing that their school is colder than usual, a group of students is asked to determine the speed of sound in their room. They are permitted to use any materials necessary; however, their lab procedure must utilize standing wave patterns. The students collect the information Table 17.9.
- Describe an experimental procedure the group of students could have used to obtain this data. Include diagrams of the experimental setup and any equipment used in the process.
- Select a set of data points from the table and plot those points on a graph to determine the speed of sound within the classroom. Fill in the blank column in the table for any quantities you graph other than the given data. Label the axes and indicate the scale for each. Draw a best-fit line or curve through your data points.
- Using information from the graph, determine the speed of sound within the student’s classroom, and explain what characteristic of the graph provides this evidence.
- Determine the temperature of the classroom.
Final Answer
- Please see the solution video.
- Google spreadsheet
Solution video
OpenStax College Physics for AP® Courses, Chapter 17, Problem 14 (Test Prep for AP® Courses)

vote with a rating of
votes with an average rating of
.
Calculator Screenshots
Video Transcript
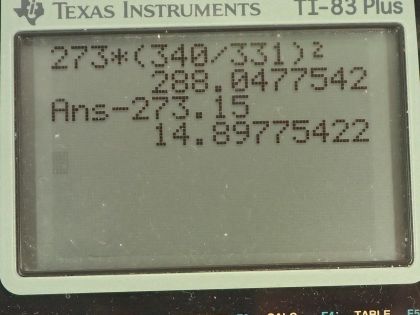
This is College Physics Answers with Shaun Dychko. Some students want to determine the speed of sound in the air in their classroom so they can use any materials that they want and they have to use a standing wave pattern— it has to be part of their experiment— and they collect this information here they have a column with wavelength in meters and a column with frequency in hertz and they do a bunch of trials to get different wavelengths corresponding to different frequencies. So an experimental procedure that we could use could consist of say five tubes of different height so these are maybe graduated cylinders and this is a tube opened at one end and closed at the other and so a resonant frequency in this tube would have a waveform such that there's a node at the closed end and an antinode at the open end and the fundamental frequency would have a wavelength that one quarter of which fits into this cylinder. So the wavelength then is one quarter of the height and that is the fundamental resonant frequency that is the lowest possible resonant frequency. So what should be done first using a ruler along with these columns is to measure the height of each column— there's five of them, I only drew three of them— and then using a tone generator, which is an app that can produce a single, pure pitch determine the lowest frequency that produces residence and you can use your ears to figure out when the residence happens... it will be a frequency where the sound is suddenly louder and then that's the information you can put into this column here the fundamental resonant frequency is what this column is then and then this is the wavelength that you can determine from this formula, which is to say wavelength is a quarter of the height of the cylinder you were using to get that frequency. Part (b) asks us to create a graph to determine the speed of sound and in order to do that, we will need to add a third column here or fourth column I guess you could say and to figure out what that column should be let's consider the wave equation which says that speed of a wave equals its frequency times its wavelength if we divide both sides by λ here we get this form which is frequency equals the speed divided by λ. So the frequency of the sound then equals the speed of sound divided by the sound's wavelength and this is in the form of y equals mx where y is the vertical axis— its frequency— and m is the slope of the graph and that's gonna be v—the speed of sound— and then x is 1 over λ. So if you were to separate these two, you could write this as v times 1 over λ so we need to have a column, which is 1 over λ and then I have created a Google spreadsheet here and it has this data copied and then this column here D is a column that I have created and it is 1 divided by B2 is the formula in this column and the next row is 1 divided by B3 so this number here is 1 divided by 1.7 in other words and the units are reciprocal meters here and then we create a graph of frequency versus reciprocal wavelength and this graph has a best fit line and you get this by clicking on the chart and then somewhere here you have a trend line under the 'Series' section and then click that and then it will put the line there for you and then under the label, choose "Use equation" and then it'll give you the equation for that line. So the slope of this line is 340 and that is the speed of sound. So there we go: 340 meters per second is our speed of sound and... (anything else we need to do there... no that's what we needed to do) Part (d) says determine the temperature of the classroom. Okay so we have this formula for the speed of sound in air it is 331 meters per second times the square root of the temperature in Kelvin divided by 273 Kelvin and then we can divide both sides by 331 and then we get this line here, square both sides and temperature over 273 equals all this squared and then multiply both sides by 273 Kelvin and the temperature then is 273 Kelvin times the speed of sound in air divided by 331 meters per second all squared. So that's 273 Kelvin times 340 meters per second— that we determined from our best fit line on our graph— divided by 331 squared and that is 288.05 Kelvin subtract 273.15 from that and we get 15 degrees Celsius is the temperature of the room and sure enough, the kids were right that this room is a little bit cold; room temperature is typically about 20 degrees Celsius.
