Question
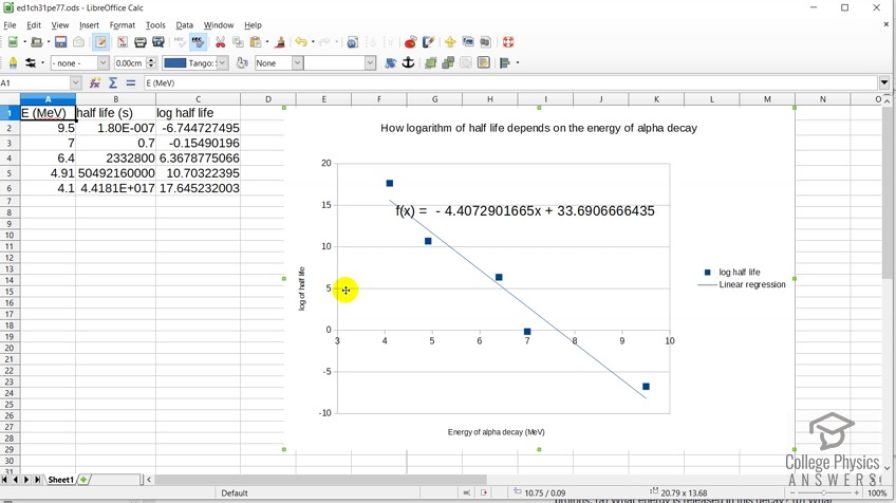
Derive an approximate relationship between the energy of decay and half-life using the following data. It may be
useful to graph the log of against to find some straight-line relationship.
| Nuclide | (MeV) | |
|---|---|---|
| 9.5 | 0.18 | |
| 7.0 | 0.7 s | |
| 6.4 | 27 d | |
| 4.91 | 1600 y | |
| 4.1 |
Final Answer
Solution video
OpenStax College Physics, Chapter 31, Problem 77 (Problems & Exercises)

vote with a rating of
votes with an average rating of
.
Video Transcript
This is College Physics Answers with Shaun Dychko. In this spreadsheet, we have plotted how the logarithm of half-life which is on this vertical axis changes with the energy of the α-decay. So for materials that have a high energy α-decay, the logarithm of a half-life is very small or negative and which also indicates a small half-life. And for the low energy α-decays, we have a large logarithm of half-life indicating a large half-life. And here is the linear regression of these data points so we have a negative slope meaning that as the α-energy energy from α-decay increases, we have a decrease in the logarithm of half-life. And that equation is shown here and yeah there we go. So I plotted— this is LibreOffice by the way; it's a free download for anybody open-source spreadsheet program— and I entered the half-lives given in the data table written in seconds so I convert into seconds here and then took the logarithm of the adjacent cell. And so this is logarithm of cell B2, this is the logarithm of cell B3 and so on. And yeah there we go.